Marginal Cost (MC):
It refers to the change in total cost due to change in additional unit of output produced.
MC = ∆TC / ∆Q
where,
MC = marginal cost
∆TC = change in total cost
∆Q = change in quantity of output produced
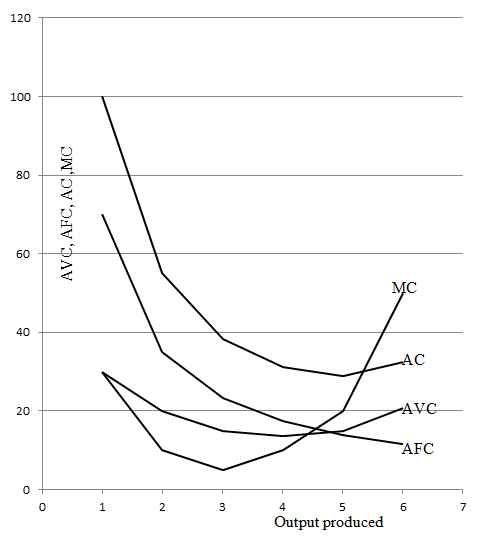
On the basis of above concepts we can derive AFC, AVC, and MC curves by the help of given table.
| Output Produced | TFC | TVC | TC | AFC | AVC | AC | MC |
| 0 | 70 | 0 | 70 | - | - | - | 70 |
| 1 | 70 | 30 | 100 | 70 | 30 | 100 | 30 |
| 2 | 70 | 40 | 110 | 35 | 20 | 55 | 10 |
| 3 | 70 | 45 | 115 | 23.33 | 15 | 38.33 | 5 |
| 4 | 70 | 55 | 125 | 17.5 | 13.75 | 31.25 | 10 |
| 5 | 70 | 75 | 145 | 14 | 15 | 29 | 20 |
| 6 | 70 | 125 | 195 | 11.66 | 20.83 | 32.5 | 50 |
On the given figure, output is measured on x-axis and average cost, MC, AVC, AFC are measured on y-axis. With the increment of output production AFC tends to decline sharply. As a result, AFC curve is downward sloping. It takes the shape of rectangular hyperbola.
With the increment of output production, initially AVC declines then reaches to the minimum point and starts to increase because of the operation. So, AVC curve is U-shaped.
In initial, AC also declines sharply reaches to the minimum point then starts to increase. So, AC curve is also U-shaped.
Initially, MC declines sharply reaches to the minimum point then start to increase. As a result, MC curve is also U-shaped. MC always cuts to the minimum point AVC and AC.


Top comments (0)