Movement along demand curve can be defined as graphical representation of change in demand for a commodity brought by change in its own price other things remaining constant. If price changes demand too changes. The change in demand is graphically shown by movement from a point to another point of same demand curve.
Rightward movement:
It is the graphical representation of expansion in demand brought by fall in price, other things remaining constant. If price falls, consumes demand more. It is called expansion in demand. It is shown by movement from a point in left side to another point in right side of same demand curve.
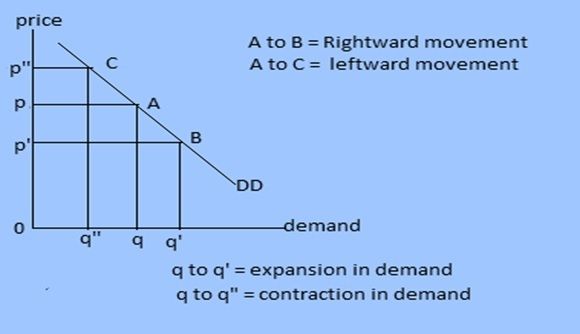
Leftward movement:
It is the graphical representation of contraction in demand brought by rise in price, other things remaining constant. If price rises, consumes demand less. It is called contraction in demand. It is shown by movement from a point in right side to another point in left side of same demand curve.
Shift in demand curve:
It can be defined as diagrammatic representation of change in demand brought by change in any other factor determining demand other than price. If any one of the factors changes, demand too changes at all possible prices. To show the change in demand, we need o construct another demand curve.
Rightward shift:
It is graphical representation of increase in demand brought by change in any other determinant other than price. To show rightward shift or increase in demand, we construct another demand curve on the right side of initial demand curve
Causes of rightward shift:
- Increase in prices of substitutes,
- Increase in income,
- Favorable change in taste and preference,
- Increase in population,
- Increase in advertisement,
- Increase in government expenditure, money supply,
- Decrease in prices of complementary goods and taxes
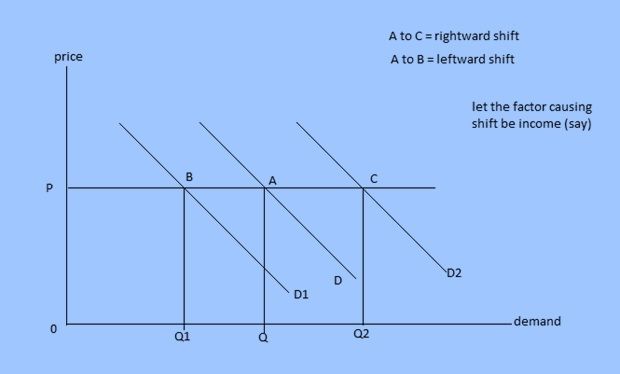
Leftward shift:
It is graphical representation of decrease in demand brought by change in any other determinant other than price. To show leftward shift or decrease in demand, we construct another demand curve on the left side of initial demand curve
Causes of leftward shift:
- Decrease in prices of substitutes,
- Decrease in income,
- Unfavorable change in taste and preference,
- Decrease in population,
- Decrease in advertisement,
- Decrease in government expenditure, money supply,
- Increase in prices of complementary goods and taxes

Top comments (0)