The supply curve can be defined as locus of quantities of a commodity that would be offered for sale at different possible prices. Each point of supply curve gives a certain quantity the firm wants to sell at a certain price. It is derived with the help of a supply schedule. The supply curve is the graphical representation of relationship between supply and price, other things remaining constant.
1. Individual supply curve:
It is defined as the locus of quantities that would be offered for sale by a single firm at different possible prices during a certain time period. It is upwardly sloped. It moves from left to right upward. It shows how an individual firm adjusts its supply to the change in price. Since every firm cam make more profit selling at higher price than at lower price, the individual supply increases with the rise in price and vice versa. The individual supply curve can be derived from individual supply schedule. It is defined as the list of quantities that would be offered for sale by a single firm at different possible prices during a certain time period. We can obtain the derivation of individual curve as following:
|
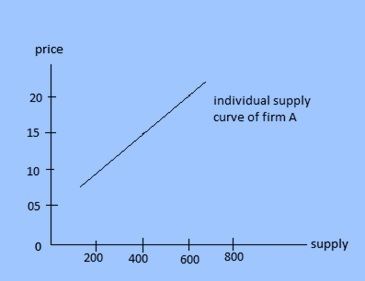
INDIVIDUAL SUPPLY CURVE OF FIRM A |
|
| Price per packet ( in Rs) | Supply per week (in packets) |
| 10 | 200 |
| 15 | 400 |
| 20 | 600 |
In the above table, supply of firm is 200, 400 and 600 packets per week when price is Rs 10, Rs 15 and Rs 20 respectively. The supply is more at higher price than at lower price. It is because the firm supplies more to earn more profit at higher price. If we represent the quantities of supply with respect to price we obtain an upwardly sloped curve as shown below
2. Market supply curve:
It is the locus of quantities that the total firms in an industry would offer for sale at different possible prices during a certain time period. Each point of it gives a certain quantity the firms in the industry want to sell in total at certain price. Since each firm supplies more at higher price than at lower price, market supply curve too increases with rise in price. Market supply at certain price is given by sum of individual supplies. Therefore, market supply curve is also called horizontal sum of individual supply curves
The market supply curve can be drives with the help of individual supply schedule and supply curves. For it, let’s assume that there are only 3 firms in an industry named A, B, and C.
|
Price( in Rs)
|
Individual supply
|
Market supply
|
In the above table, when the price is Rs 10 the individual supply of firms A, B and C are 2,4 and 3 respectively. If we add these quantities we obtain a market supply of firm A, 9 units at the price Rs 10. Similarly, if we add the quantities that the firm B wants to sell at Rs 15 and Rs 20 we obtain market supply 24 units and 19 units respectively. Representing their quantities we obtain an upwardly sloped market supply curve as shown below.
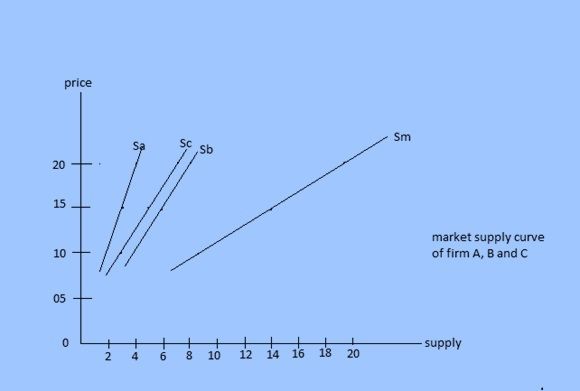
In the figure Sa, Sb and Sc represents individual supply curves of firms A, B and C respectively. All of them upwardly sloped. Sm the market supply curve is also upwardly sloped. Sm is the horizontal summation of Sa, Sb and Sc respectively.

Top comments (0)