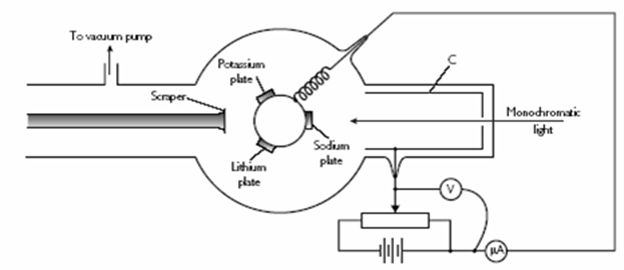
Let us consider a glass tube (discharging tube) which consists of two electrodes; anode(A) an cathode(c) . It is connected as shown in fig. The experimental setup shows the Millikan’[s experiment to determine the value of plank’s constant as well as to verify the Einstein’s photoelectric effect .
In fig. µA (micro ammeter ) , V, Rh and Rc one micro ammeter, voltmeter, rheostat (potential divider) and reverse switch respectively .
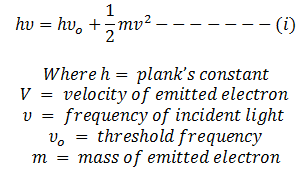
If certain frequency of light (selected from light filter) is exposed to photo metal at the cathode electrons are emitted from the metal surface which are directed towards the anode as a result photo current can be measured by µA . Then, according to Einstein’s photoelectric equation, We have,
If anode potential is adjusted to that photocurrent becomes zero, then KE of electron becomes zero. Then KE of electron becomes equal to stopping potential i.e.
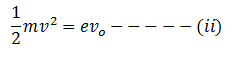
Where, e = electric charge
Vo = stopping potential
Now from equation i and ii we get,
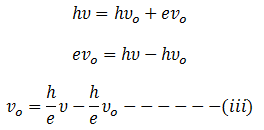
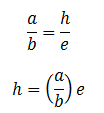
This equation is the equation of straight line which is in the form y = m x + c with the slope h/e and intercept (c):

If we use different light filter to select different frequency of light, corresponding values of stopping potential varies. This variation can be realized in fig 2 and 3
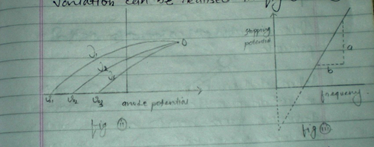
fig-iii clearly indicates that with the increase of frequency of incident light corresponding stopping potential increases and the pints always gives the straight line. The slope of straight line in fig-iii is graphically equal to the slope of given equation-iii
The experimentally obtained value of h is 6.631 into 10 -34 Joule sec. Hence milliken’s experiment verifies Einstein’s photoelectric equation and determine the value of plank’s constant (h).

Top comments (0)