The demand curve can be defined as locus of quantities of a commodity demanded at different possible prices. Each point of demand curve gives a certain quantity demanded at a price. It is derived with the help of a demand schedule. The demand curve is the graphical representation of relationship between demand and price, other things remaining constant.
There are two types of demand curve:
1. Individual demand curve : It is defined as the locus of quantities that a single consumer would purchase at different possible prices. It is downward sloped. It moves from left to right downward. It shows how an individual consumer adjusts his/her demand to the change in price. We can obtain the derivation of individual curve as following:
Let a consumer named “A” wants to purchase the following quantities of a commodity at different possible prices as shown in the table below.
| PRICE PER LITER | DEMAND FOR A WEEK |
| Rs 10 | 30 liters |
| Rs 15 | 20 liters |
| Rs 20 | 10 liters |
In the above table, the individual demand schedule of consumer A is 30, 20 and 10 liters per week at a price Rs 10, Rs 15, Rs 20 respectively. The table is the list of quantities the consumer A want to purchase at different possible prices. It is called individual demand schedule of consumer A. if we represent the quantities with respect to the pries we obtain downward sloped curve. The curve is individual curve of consumer A.
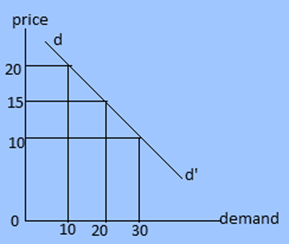
In the above figure, dd’ is the individual demand curve of consumer A. it is downward sloped. It shows the consumer “A” wants to purchase more quantity at lower price and less quantity at higher price.
2. Market demand curve : It is defined as the locus of quantities that the total consumer would purchase at different possible prices. It is a horizontal summation of individual demand curves. It is obtained representation the market demand with respect to price. The market demand at a certain price is the sum of individual demands. Since, every consumer wants to purchase more quantity at lower price and less quantity at higher price, the market demand too is inversely related to the price. That’s why like individual demand curves, market demand curve too is downward sloped.
we can derive market demand curve with the help of individual demand schedules and individual demand curves as following
| Price | Demand A | Demand B | Demand C | Market demand M=A+B+C |
| Rs 10 | 5 | 6 | 3 | 14 |
| Rs 15 | 3 | 5 | 2 | 10 |
| Rs 20 | 1 | 4 | 1 | 6 |
In the above table, when price is Rs 10 the consumers A, B and C have demanded 5,6 and 3 units respectively. Here, we have assumed that there are only 3 consumers of the commodity. If we sum up these quantities, we obtain market demand as 14 units at price Rs 10. If price rises to Rs 15, the consumers reduce their demand to 3, 5 and 2 units respectively. If we sum up these quantities, we obtain market demand as 10 units at price Rs 15. Similarly, summing up the quantities 1, 4 and 1 unit at price of Rs 20 that consumers want to purchase, we can obtain the market demand 6 units. If we represent the 14, 10 and 6 units the consumer want to purchase at prices Rs 10, 15 and 20, we obtain market demand curve as shown in the figure.
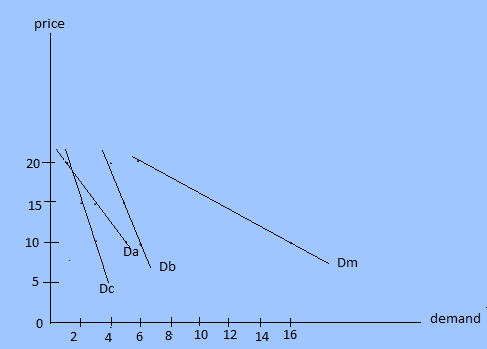
In the figure above, Dm represents the market demand curve. It is downward sloped. It is obtained by summing up the individual demand curve Da, Db and Dc horizontally.

Top comments (0)