Derivation of TR, AR and MR curves under monopoly market:
In monopoly market there is only one producer or seller and large no. of consumers. There is lack of production of close substitutable commodities. Price of commodity is determined by the producer. So, firm is price maker and consumers are price taker. To increase the sale of output producer must reduce the price of the commodity. On the basis of this concept we can derive TR, AR and MR curves.
| Output sold (Q) | Price (P) | TR = P × Q | AR = TR / Q | MR = ∆TR / ∆Q |
| 1 | 10 | 10 | 10 | 10 |
| 2 | 9 | 18 | 9 | 8 |
| 3 | 8 | 24 | 8 | 6 |
| 4 | 7 | 28 | 7 | 4 |
| 5 | 6 | 30 | 6 | 2 |
| 6 | 5 | 30 | 5 | 0 |
| 7 | 4 | 28 | 4 | -2 |
| 8 | 3 | 24 | 3 | -4 |
On the given table, output sold is gradually increasing at equal rate from 1 to 8. About TR, at initial stage, TR increases then remains constant after certain output sold and decreases at increasing rate. AR gradually declines at equal rate as per increasing rate of output sold. About MR, it decreases at constant rate.
On the basis of given table we can derive following graph:
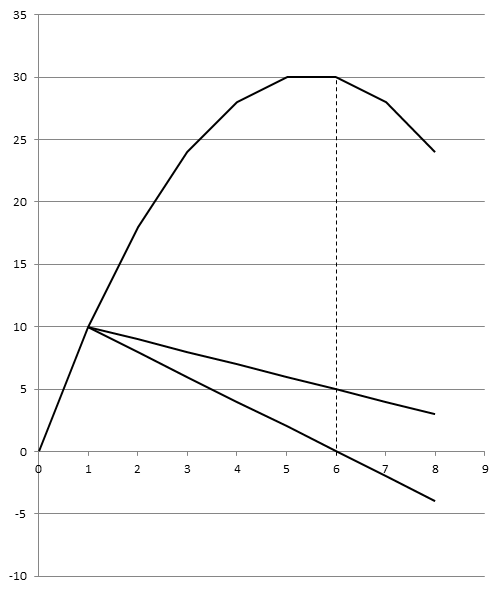
On the given figure, output sold and revenue are measured along x and y-axis respectively. With the increase of output sold, TR curve increases at decreasing rate reaches to maximum and remains constant. When 6 units of output sold, TR starts to decline at increasing rate. AR curve gradually decreases but never touches x-axis. MR curve declines sharply than AR. It cuts to the x-axis when TR is at maximum and declines negatively when TR starts to decrease.

Top comments (0)