Optimum Population
It is not that only Number of people living in a country can determine whether or not a country is under or over populated. The population of a place can be sufficient to utilize the resources of a particular place but can be over or under to another. Labor is required for The production of a commodity and therefore there is need of proportionate use of labor with response to resources available to control the over and under the use of natural, capital, physical and economical sources. Hence, according to J.L. Hanson “The amount of labor which, combined with the other factors of production, yields the maximum output is the optimum population for that particular country”. Optimum population is number of population that a country should have with respect to its resources. When a country’s population is neither too big nor too small but just that much which the country has, it is called optimum population. Hence, the optimum population can be defined as the one on which output per capita is highest.
Under Population
When population is below optimum level, it is the case of under population. The number of people is insufficient for the utilization of natural and capital resources. Under such situation, the increase in population will lead to increase in output per capita. Increase in population increases labor force and thus division of labor will be possible and then there will be proper utilization of resources. The market for product will increase. Finally, the point is reached at which the output per capita is the highest.
Over Population
If the population of a country is over optimum level, it is the case of over population. Condition may arise when country can be not rich in natural and capital resources but is economically over-populated, although in terms of numbers its population is small. The resources available will be insufficient to provide employment to all. The output per capita will diminish. Standard of living will fall.
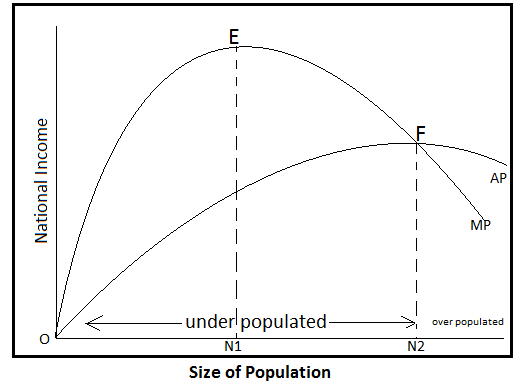
In the figure, OX axis represents size of population and OY axis represents national income. MP is the marginal product curve. In the beginning as the nation’s population increases, each new citizen adds more to total output. As the population goes on increasing, MP goes on diminishing due to diminishing return. In figure falling marginal product sets in after the population has reached N1.AP is the per capita output curve or average product curve. The AP curve first slopes upward, reaches maximum and then slopes downwards. It means that in the beginning, as the population increases. Output per capita increases till N2 are reached. Eventually, the falling marginal product will cause a fall in the average product. In the figure the average product per person begins to fall when the population reaches N2. The population that maximizes output per person is N2. At N2 level of population, output per capita is highest and is equal to N2 F. F is the maximum point. Therefore, N2 is the optimum population. If the population of a country is less than N2, it is under populated and if more than N2, it is over-populated. If the population increases beyond N2, output per capita begins to decline.


Top comments (0)