Movement along supply curve can be defined as graphical representation of change in supply for a commodity brought by change in its own price other things remaining constant. If price changes supply too changes. The change in supply is graphically shown by movement from a point to another point of same supply curve.
Rightward movement:
It is the graphical representation of expansion in supply brought by rise in price, other things remaining constant. If price rises, the firm gets more revenue per unit. To earn more profit it supplies more. The effect of rise in price in supply is called expansion in supply. It is shown by movement from a point in left side to another point in right side of same supply curve.
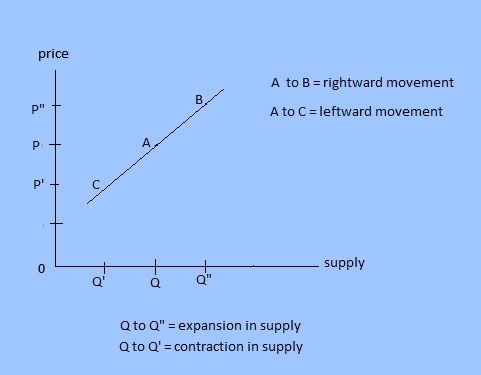
Leftward movement:
It is the graphical representation of contraction in supply brought by fall in price, other things remaining constant. If price falls, the firm gets less revenue per unit so it supplies less. The effect of fall in price in supply is called contraction in supply. It is shown by movement from a point in right side to another point in left side of same supply curve.
Shift in demand curve:
It can be defined as diagrammatic representation of change in supply brought by change in any other factor determining supply other than price. If any one of the factors changes, supply too changes at all possible prices. To show the change in supply, we need o construct another supply curve
Rightward shift: It is graphical representation of increase in supply brought by change in any other determinant other than price. To show rightward shift or increase in supply, we construct another supply curve on the right side of initial supply curve
Causes of rightward shift:
- Fall in interest rate, wage rate and rent
- Fall in prices of raw materials
- Advancement in technology, skill and knowledge development among workers
- Decrease in corporate and indirect taxes
- Increase in availability of resources
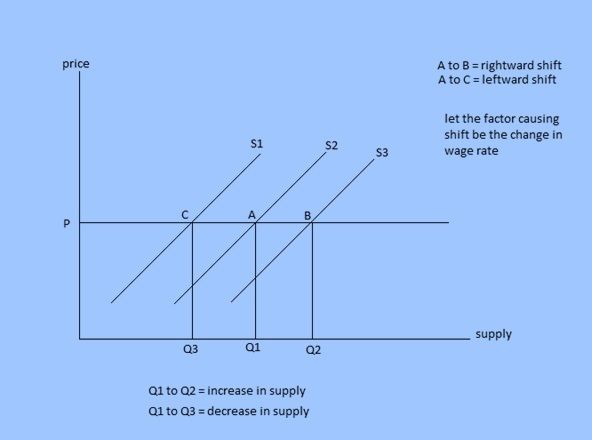
Leftward shift:
It is graphical representation of decrease in supply brought by change in any other determinant other than price. To show leftward shift or decrease in supply, we construct another supply curve on the left side of initial supply curve
Causes of leftward shift:
- Rise in interest rate, wage rate and rent
- Rise in prices of raw materials
- Destruction in technology, skill and knowledge development among workers
- Increase in corporate and indirect taxes
- Decrease in availability of resources

Oldest comments (0)